Facebook
 X
X
 Pinterest
 Copy Link
Housing Market Remains Stable
The local housing market continued its steady streak in June, with 745 homes exchanging hands via the MLS® System of the London and St. Thomas Association of REALTORS® (LSTAR). Housing supply increased from 1.7 months of inventory in May to 2.2 months of inventory in June, showing signs of market stabilization.
“The sales activity in June is consistent with the activity from the last several months,” said 2023 LSTAR President Adam Miller. “This happened despite another interest rate hike last month. Halfway through the year, the sales demonstrate the strong demand for home across the region, which is very encouraging.”
The table below highlights home sales, average home prices and benchmark prices in LSTAR’s jurisdiction over the past four months.
|
March |
April |
May |
June |
|
|---|---|---|---|---|
|
LSTAR |
685 | 723 | 846 | 745 |
|
LSTAR’s Overall Average Price |
$653,611 | $664,149 | $682,561 | $675,923 |
|
LSTAR’s Composite MLS® HPI Benchmark Price |
$592,600 | $607,200 | $619,800 | $626,200 |
“Although the data indicates a more stable marketplace, it’s important to remember that every home transaction is unique,” Miller said. “Depending on what the Bank of Canada decides to do during its July 12 announcement, your local REALTOR® can provide the necessary support on navigating the evolving environment, with real-time data and professional guidance.”
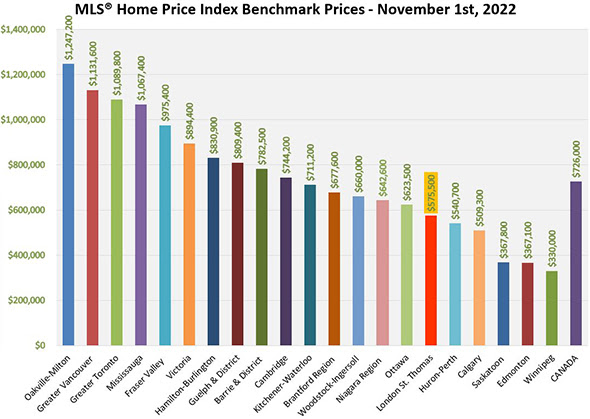
The June average home price was $675,923, slightly down from $682,561 in May. The composite MLS® Home Price Index (HPI) Benchmark Price was $626,200, up from $619,800 in May. The HPI benchmark price reflects the value of a “typical home” as assigned by buyers in a certain area based on various housing attributes, while the average sales price is calculated by adding all the sale prices for homes sold and dividing that total by the number of homes sold. The HPI benchmark price is helpful to gauge trends over time since averages may fluctuate by changes in the mix of sales activity from one month to the next.
The table below shows the June benchmark prices for all housing types within LSTAR’s jurisdiction, comparing changes from the previous month and three months ago.
| BENCHMARK TYPE | JUNE 2023 | CHANGE OVER MAY 2023 | CHANGE OVER MARCH 2023 |
| LSTAR Composite | $626,200 | ↑1.0% | ↑5.6% |
| LSTAR Single-Family | $674,300 | ↑1.1% | ↑5.3% |
| LSTAR One Storey | $610,300 | ↑0.5% | ↑5.7% |
| LSTAR Two Storey | $719,200 | ↑1.5% | ↑5.2% |
| LSTAR Townhouse | $520,300 | ↑1.3% | ↑4.8% |
| LSTAR Apartment | $392,800 | ↓0.3% | ↑12.8% |
 displayed in the left upper corner of your screen to reveal all the bookmarks of the document.