
 Facebook
 X
X
 Pinterest
 Copy Link
June 2024 Market Watch
|

|


Market Watch for May 2024
|
LSTAR’S NEWS RELEASE FOR MAY 2024 |
|
May Housing Market Remains Stable |
|
The local housing market continued its steady streak in May, with 774 homes exchanging hands via the MLS® System of the London and St. Thomas Association of REALTORS® (LSTAR). Housing supply showed signs of market stabilization, with three months of inventory in May, unchanged from the month before. Year to date, sales are outpacing 2023, with 3,161 total sales, up 1.8% from the same period last year.
“We continue to see the trend of more new listings coming on the market, which explains the healthy level of housing stock across LSTAR’s region,” said 2024 LSTAR Chair Kathy Amess. “In May, there were 1,563 new listings, slightly up from the 1,425 new listings in April, with an overall sales-to-new listing ratio of 49.5%. According to the Canadian Real Estate Association (CREA), a ratio between 40% and 60% is generally consistent with a balanced market.” Average sales price was $660,430, down 2.8% compared to May 2023. It is slightly up from the $656,037 average sales price recorded in April. Meanwhile, the Composite MLS® Home Price Index (HPI) Benchmark Price was $607,100, down 0.1% from a month ago and up 4.5% compared to six months ago. The table below displays May’s average prices and MLS® HPI Benchmark Prices in LSTAR’s main regions. |
 |
|
The HPI benchmark price reflects the value of a “typical home” as assigned by buyers in a certain area based on various housing attributes, while the average sales price is calculated by adding all the sale prices for homes sold and dividing that total by the number of homes sold. The HPI benchmark price is helpful to gauge trends over time since averages may fluctuate by changes in the mix of sales activity from one month to the next. “Although the May data indicates a stable marketplace, it’s important to note every home transaction is different based on a multitude of factors,” Amess said. “LSTAR is keeping a close eye on the Bank of Canada’s next announcement, which is scheduled to happen on June 5. Whatever it decides will impact activity over the summer season.” The following table displays May’s benchmark prices for all housing types within LSTAR’s jurisdiction and shows how they compare with those recorded in the previous month and three months ago. |
 |
March 2024 Market Updates
|
LSTAR’S NEWS RELEASE FOR MARCH 2024 |
|
Home Prices Continue to Rise in March |
|
636 homes were sold last month via the MLS® System of the London and St. Thomas Association of REALTORS® (LSTAR), 11.3% less than in March 2023. The number of newly listed properties surged from 1,024 in February to 1,233 in March, marking a 11.8% increase over a year ago.
“For LSTAR, this was the March with the lowest number of home sales in the last decade, partly because of the statutory holiday Good Friday, which fell at the end of the month this year, and not in April, as usual,” said 2024 LSTAR Chair Kathy Amess. “However, the number of new listings was in line with the Association’s ten-year average for the month of March,” she pointed out.
Out of the 636 homes exchanging hands in March in LSTAR’s jurisdiction, 449 were single-family homes, 103 were townhouses, and 63 – apartments. The average price for a single-family home in the London-St. Thomas area rose from $682,780 in February to $708,044 last month, while that of a townhouse climbed from $507,229 to in February to $531,369 last month. The average price of an apartment from our region surged from $382,496 in February to $403,560 in March. “In addition, the average prices for townhouses and apartments saw slight year-over-year gains, rising by 1.7% and 4.9% respectively,” Amess observed. “However, when compared to March 2023, the average price of a single-family home from our area decreased by 0.2%,” she added.
Overall, the housing supply increased slightly in our region – from 2.7 months of inventory in February to 2.9 months in March. “LSTAR’s sales-to-new listings ratio sat at 51.6% last month, indicating a highly balanced real estate market,” Amess said.
The average home price for the entire jurisdiction of LSTAR saw a healthy month-over-month growth – from $617,790 in February to $646,155 last month – but was 0.2% lower than in March 2023. However, the Composite MLS® Home Price Index (HPI) Benchmark Price posted month-over-month and year-over-year increases – of 2.6%, and 1.6% respectively – hiking to $602,700.
The table below displays an analysis of March’s average and MLS® HPI Benchmark prices in LSTAR’s main regions. |
 |
|
“When looking at last month’s figures, it’s essential to understand the difference between average prices and MLS® benchmark prices. The latter reflects the image of a ‘typical home’ from a specific area as perceived by the local home buyers, unveiling, at the same time, what housing attributes these buyers value the most. In contrast, the average sales price is calculated by adding all home sale prices and dividing the total sum by the number of homes sold. Because average prices can experience high fluctuations from one month to the next, due to only a few outliers from the sales activity mix, the HPI benchmark price is a more reliable tool for tracking trends over time,” Amess stated. The following table shows March’s benchmark prices for all housing types within LSTAR’s jurisdiction and how they compare with those recorded in the previous month and three months ago. |
 |
April 2024 Market Updates
|
LSTAR’S NEWS RELEASE FOR APRIL 2024 |
|
April Shows More Signs of Stabilization |
|
In April, 710 homes exchanged hands via the London and St. Thomas Association of REALTORS® (LSTAR) MLS® System, a slight decrease of 2.9% compared to the same month a year ago. Year to date, there have been 2,381 total sales, up 6.1% from the first four months of 2023. “More new listings came on the market in April, which continues to show a marketplace with some balance between buyers and sellers,” said 2024 LSTAR Chair Kathy Amess. “We saw 1,425 new listings, up 43.8% over the previous year, with an overall sales-to-new listing ratio of 52%. According to the Canadian Real Estate Association (CREA), a ratio between 40% and 60% is generally consistent with a balanced market.” The average sales price in April was $656,037, slightly down 1.5% compared to April 2023. It is slightly up 1.5% from the average sales price in March, which was $646,155. Meanwhile, the Composite MLS® Home Price Index (HPI) Benchmark Price was $602,800, unchanged from a month ago and up 5.1% compared to three months ago. The table below displays April’s average prices and MLS® HPI Benchmark Prices in LSTAR’s main regions. |
 |
|
The HPI benchmark price reflects the value of a “typical home” as assigned by buyers in a certain area based on various housing attributes, while the average sales price is calculated by adding all the sale prices for homes sold and dividing that total by the number of homes sold. The HPI benchmark price is helpful to gauge trends over time since averages may fluctuate by changes in the mix of sales activity from one month to the next. “It’s important to remember that every home transaction is unique,” Amess said. “Based on what the Bank of Canada decides to do during its next announcement on June 5, your local REALTOR® can help navigate this ever-changing environment, with real-time data, market insights and professional guidance.” The following table displays April’s benchmark prices for all housing types within LSTAR’s jurisdiction and shows how they compare with those recorded in the previous month and three months ago. |
 |
Market Watch for Feb 2024 by LSTAR
|
|


January 2024 Market Watch by LSTAR
|
|


Market updates for December 2023
|
|


LSTAR’S NEWS RELEASE FOR NOVEMBER 2023
|
|


|
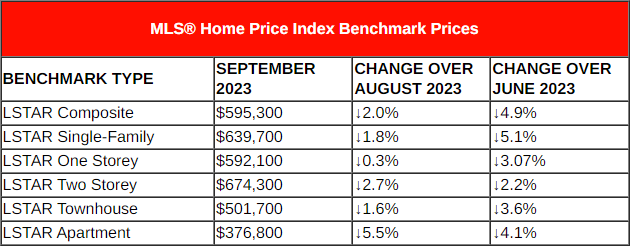
September 2023 Shows More Signs of Stabilization
|
|

|
Home Sales Taper off in August 2023
|
|


