LSTAR’s News Release for November 2022
Local Housing Market’s Correction Continues
451 residential properties exchanged hands last month through the Multiple Listing Service® (MLS®) System of the London and St. Thomas Association of REALTORS® (LSTAR), 44% less than in November 2021. LSTAR Members’ home sales included 336 single family homes, 64 condo townhouses, and 36 apartments – all significantly down from a year ago.
“In the last two years, the local housing market’s frenzy was artificially fueled by the socio-economic climate of the pandemic. Now, that the socio-economic conditions are completely different, the local housing market is in correction mode,” said Randy Pawlowski, 2022 LSTAR President. “The market is especially affected by the Bank of Canada’s interest rate hikes, which intensify buyer reluctance and weaken people’s purchasing power,” he added.
While residential transactions were at their lowest point in the last decade, the number of new listings climbed to 875 in November, a new record high for the eleventh month of the year. This increased the level of the local housing inventory, which sits now at 3.3 months.
“The housing demand is still high in our area, and with the increased levels of inventory, local Buyers have now more choices and time to shop for new homes. However, the uncertain economic conditions are keeping many prospective Buyers on the sidelines,” Pawlowski observed.
Compared to a year ago, the average home price decreased, but remained higher than the figures seen in 2020 and before. LSTAR’s overall average home price was $615,247 in November, 7.8% less than a year ago, but 13.8% higher than in November 2020. On the other hand, the composite MLS® Home Price Index (HPI) Benchmark Price was $575,500 last month, 10% down from last year, and also 9.8% lower than in November 2020.
The following table shows how November’s average home prices in LSTAR’s main regions compare to the benchmark prices for the same areas.
| Area | November 2022 MLS® HPI Benchmark Price | November 2022 Average Price |
|---|---|---|
| Central Elgin | $582,300 | $622,909 |
| London East | $468,500 | $502,606 |
| London North | $687,400 | $705,725 |
| London South | $569,800 | $617,379 |
| Middlesex Centre | $812,200 | $921,460 |
| St. Thomas | $492,900 | $515,180 |
| Strathroy-Caradoc | $712,200 | $637,977 |
| LSTAR | $575,500 | $615,247 |
All housing types recorded year-over-year decreases in both their average and HPI benchmark prices. “As with any major asset, it’s important to take a long-term approach when looking at how much your investment has appreciated. The substantial home equity gains seen over the last two years were not sustainable. However, if you have owned your property for a longer period of time, your equity has increased significantly and can buffer the new price corrections,” Pawlowski explained.
The following table shows the November benchmark prices for all housing types in LSTAR’s jurisdiction and how they compare with the values from the previous year.
| BENCHMARK TYPE | NOVEMBER 2022 | CHANGE OVER NOVEMBER 2021 |
| LSTAR Composite | $575,500 | ↓10.0% |
| LSTAR Single-Family | $614,000 | ↓10.2% |
| LSTAR One Storey | $562,000 | ↓7.3% |
| LSTAR Two Storey | $649,500 | ↓11.8% |
| LSTAR Townhouse | $490,800 | ↓9.9% |
| LSTAR Apartment | $391,200 | ↓5.4% |
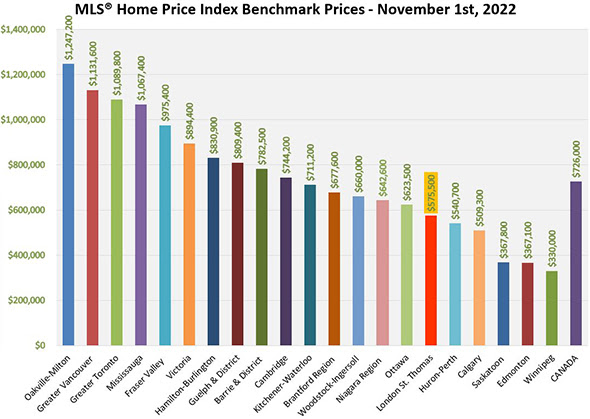
“When compared to other values recorded provincially and nationally, homes in our area continue to remain relatively affordable,” Pawlowski said. The following chart shows HPI benchmark prices for November, courtesy of CREA.

 Facebook
 X
X
 Pinterest
 Copy Link

