Facebook
 X
X
 Pinterest
 Copy Link
LSTAR’s News Release for September 2021
LSTAR Home Sales on Track for a Record Year
In September 2021, the London and St. Thomas Association of REALTORS® (LSTAR) experienced another solid month, with 864 residential transactions recorded via its MLS® system. “This value, which represents the second-highest number of homes sold in the month of September in LSTAR’s jurisdiction since 1978, puts us on track for a record year. In the first nine months of this year, 8,756 homes traded hands in our area, which is an unprecedented total for our September year-to-date figures,” said 2021 LSTAR President Jack Lane.
1,057 new listings came on the local market last month, on par with the values seen in the pre-pandemic years. However, at the end of the month, there were only 628 active listings left – the lowest amount of active listings ever seen by LSTAR in September. “These figures show clearly that houses in our area are in very short supply. The shortage is also demonstrated by the very low number of months of inventory – 0.6, which indicates that, at the current sales pace, it would take only a bit over two weeks to liquidate the entire existing housing inventory of LSTAR,” explained Lane.
Both benchmark and average sales prices continued to rise last month. In September, the overall average home price for LSTAR was $690,861, while the LSTAR composite MLS® HPI benchmark price sat at $596,400.
The following table shows how September’s average sales prices compare to the benchmark prices. The MLS® Home Price Index (HPI) benchmark price reflects the value of a “typical home” from a specific area as perceived by local home buyers based on various housing attributes. The average sales price is calculated by adding the sale prices for all the homes sold and dividing that total by the number of transactions. Since monthly averages may be skewed by the type of houses sold in that timeframe, the HPI benchmark price is a more accurate way to gauge price trends.
| Area | September 2021 MLS® HPI Benchmark Price | September 2021 Average Price |
|---|---|---|
| Central Elgin | $620,600 | $613,571 |
| London East | $516,300 | $505,641 |
| London North | $711,400 | $752,925 |
| London South | $588,100 | $658,973 |
| Middlesex Centre | $876,900 | $921,217 |
| St. Thomas | $504,700 | $526,599 |
| Strathroy-Caradoc | $698,100 | $638,078 |
| LSTAR | $596,400 | $690,861 |
The single-family home remains on top of the local buyers’ preferences, with 648 sales in September. “Yet, it is worth mentioning that, so far, both condo townhouses and apartments had their best year ever, with 1,087 and 812 units respectively exchanging hands year-to-date,” Lane noted.
The table below shows the September benchmark prices for all housing types in LSTAR’s jurisdiction and how they stack up against the values from a year ago.
| MLS® Home Price Index Benchmark Prices | ||
|---|---|---|
| Benchmark Type | September 2021 | Change over September 2020 |
| LSTAR Composite | $596,400 | ↑ 31.7% |
| LSTAR Single-Family | $644,900 | ↑ 33.6% |
| LSTAR One Storey | $600,200 | ↑ 34.6% |
| LSTAR Two Storey | $689,500 | ↑ 33% |
| LSTAR Townhouse | $479,600 | ↑ 32% |
| LSTAR Apartment | $336,200 | ↑15.5 % |
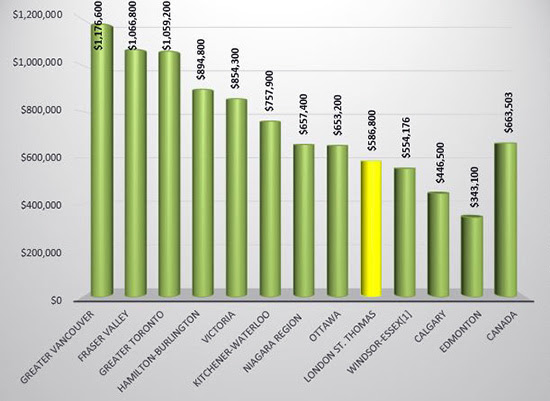
The following chart is based on data taken from the CREA National Price Map for August 2021.