UncategorizedUncategorizedUncategorizedUncategorizedUncategorizedUncategorizedUncategorizedUncategorizedUncategorizedUncategorizedUncategorizedUncategorized November 3, 2022

October 2022 Market updates from London Board

LSTAR’s News Release for OCTOBER 2022

Rising Borrowing Costs Further Soften Local Home Sales

In October 2022, the MLS® System of the London and St. Thomas Association of REALTORS® (LSTAR) saw 975 new listings and 504 home sales. While October’s new listings were on par with the average value recorded for the month of October throughout the last decade, the monthly home sales were at their lowest point in the last ten years.

“This year’s successive increases in interest rates put a big dent in the local home sales activity and made the year-over-year price values plunge. However, it’s not all bad news: LSTAR’s sales-to-new listings ratio increased from 42.4% in September to 51.7% in October, which indicates a more balanced market. Moreover, the overall average home price in the London-St. Thomas region was a bit higher in October than during the previous month, increasing from $635,256 in September to $640,570 last month,” said 2022 LSTAR President Randy Pawlowski.

Compared to a year ago, both the average home price and the composite MLS® Home Price Index (HPI) Benchmark Price edged slightly down but remained higher than the figures seen in 2020 and before. LSTAR’s overall average home price was $640,570 in October, 4.1% less than a year ago, but 21.7% higher than in October 2020. The composite MLS® HPI Benchmark Price sat last month at $584,200, 2.1% lower than last year, but 26.1% higher than in October 2020.

The following table shows how October’s average home prices in LSTAR’s main regions compared to the benchmark prices for the same areas.

Area October 2022 MLS® HPI Benchmark Price October 2022 Average Price
Central Elgin $589,900 $774,480
London East $475,500 $491,525
London North $701,300 $814,524
London South $577,300 $593,593
Middlesex Centre $828,100 $1,364,559
St. Thomas $502,000 $509,198
Strathroy-Caradoc $700,000 $609,494
LSTAR $584,200 $640,570

The single-family home remained at the top of the local home buyers’ preferences, with 363 homes sold in October, followed by condos, with 73 townhouses exchanging hands.

“Despite having the lowest number of units sold (37), apartments recorded actual gains in both their average and HPI benchmark prices, unlike single-family homes and condos, which saw year-over-year decreases. More specifically, in October, the average price of an apartment in the London-St. Thomas region was $416,516, 8% higher than in October 2021, while its HPI benchmark price was $398,600, up 2% over the same time a year ago,” Pawlowski observed.

The following table shows the October benchmark prices for all housing types in LSTAR’s jurisdiction and how they compare with the values from the previous year.

MLS® Home Price Index Benchmark Prices
BENCHMARK TYPE OCTOBER 2022 CHANGE OVER OCTOBER 2021
LSTAR Composite $584,200 ↓5.6%
LSTAR Single-Family $624,900 ↓6.2%
LSTAR One Storey $559,400 ↓6.5%
LSTAR Two Storey $669,800 ↓5.9%
LSTAR Townhouse $489,400 ↓1.4%
LSTAR Apartment $390,800 ↑2.0%

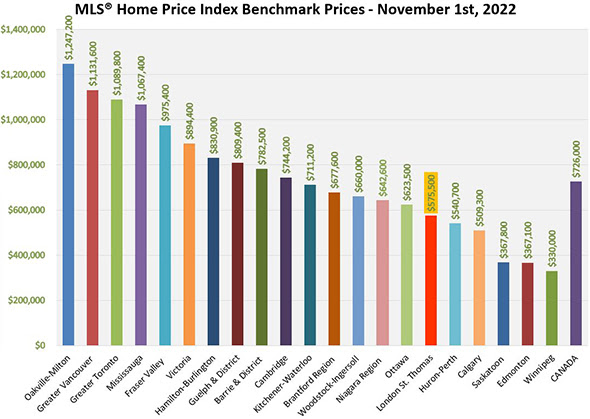
“When compared to other values recorded provincially and nationally, homes in our area continue to remain relatively affordable,” Pawlowski said. The following chart shows HPI benchmark prices for October, courtesy of CREA.

Read more

October 5, 2022

September Home Sales Continue Cooling Trend

LSTAR’s News Release for SEPTEMBER 2022

September Home Sales Continue Cooling Trend

The local housing market continued to cool off in September, with 497 homes exchanging hands via the MLS® System of the London and St. Thomas Association of REALTORS® (LSTAR). Housing supply made a healthy gain from 2.7 months of inventory in August to 3.4 months of inventory in September, showing more signs of market stabilization.

“An additional interest rate hike, the fifth one so far in 2022, continues to impact home sales activity,” said 2022 LSTAR President Randy Pawlowski. “We are experiencing increased inventory levels, indicating a more balanced marketplace. For historical perspective, the 3.4 months of inventory is the highest recorded for the month of September, since September 2015.”

The average home sales price and composite MLS® Home Price Index (HPI) Benchmark Price both edged slightly down from August to September. LSTAR’s overall average home price fell from $648,036 in August to $635,256 in September. The composite MLS® HPI Benchmark Price saw a marginal decrease from $599,500 in August to $596,900 in September. The data represents a trend the majority of local real estate markets are seeing across the country, according to the Canadian Real Estate Association (CREA).

“Although the market is slowly stabilizing, it’s important to remember that every home transaction is unique,” Pawlowski said. “As the market evolves, your local REALTOR® can provide support on how to navigate this changing environment, with real-time data and professional guidance.”

The following table shows how September’s average home sales prices in LSTAR’s main regions compared to the benchmark prices for the same areas.

Area September 2022 MLS® HPI Benchmark Price September 2022 Average Price
Central Elgin $601,400 $675,231
London East $487,900 $495,326
London North $713,000 $759,555
London South $591,000 $614,261
Middlesex Centre $839,600 $1,025,445
St. Thomas $508,800 $541,569
Strathroy-Caradoc $719,100 $733,215
LSTAR $596,900 $635,256

“The single-family home remained the most popular style choice for local home buyers with 365 units sold, while apartments had the largest gain in average price, up 8.3% over the same time a year ago,” Pawlowski said.

The following table shows the September benchmark prices for all housing types in LSTAR’s jurisdiction and how they stack up against the values from the previous year.

MLS® Home price Index Benchmark Prices
BENCHMARK TYPE SEPTEMBER 2022 CHANGE OVER SEPTEMBER 2021
LSTAR Composite $596,900 ↓1.3%
LSTAR Single-Family $641,000 ↓1.1%
LSTAR One Storey $578,900 ↓0.2%
LSTAR Two Storey $683,500 ↓1.5%
LSTAR Townhouse $496,200 ↓2.4%
LSTAR Apartment $390,800 ↓0.8%

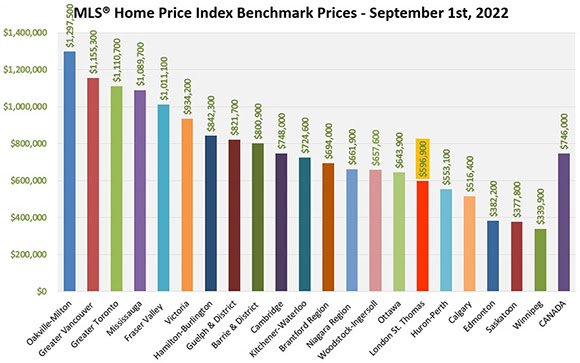
“When compared to other values recorded provincially and nationally, homes in our area continue to remain relatively affordable,” Pawlowski said. The following chart shows HPI benchmark prices for September, courtesy of CREA.

Read more

September 7, 2022

Aug 2022 Market Update Summary

September 7, 2022

LSTAR’s News Release for August 2022

LSTAR’s News Release for August 2022

August Signals a Soft Landing of the Local Real Estate Market

The number of homes sold in the jurisdiction of the London and St. Thomas Association of REALTORS® (LSTAR) fell by 34.8% in August from the same month last year, but saw an increase over the previous month, which indicates a soft landing of the local real estate market. More specifically, 607 residential transactions were recorded last month by LSTAR’s MLS® System – 324 less than a year ago, but up by 93 units from July.

“The softness seen over the last few months in the local real estate market was, undoubtedly, caused by the continuous rise in the mortgage interest rates, which has translated into higher borrowing costs,” said 2022 LSTAR President Randy Pawlowski. “However, the sales-to-new listings ratio, which reflects the share of new listings out of the total number of home sales, increased from 41.8% in July to 56.7% in August, moving our market into a more balanced territory,” he added. “This is encouraging, as it could signal a bit more support for the home selling prices in the coming months.”

In August, LSTAR’s composite MLS® Home Price Index Benchmark Price was $599,500, down 4% from July. However, this value is still 0.5% higher than the figure recorded for August 2021. Similarly, LSTAR’s overall average home price dropped slightly from $667,323 in July to $648,036 in August. Compared to the same period last year, this figure is still 5.2% higher. This represents a trend the majority of local markets are experiencing across the country, according to the Canadian Real Estate Association (CREA).

“When looking to buy or sell a home, it’s essential to remember that each transaction is unique and does not always reflect the trends observed in the overall activity of the local marketplace,” Pawlowski said. “Especially in changing markets, the expertise and real-time data provided by your local REALTOR® can be invaluable resources.”

The following table shows how August’s average home sales prices in LSTAR’s main regions compared to the benchmark prices for the same areas.

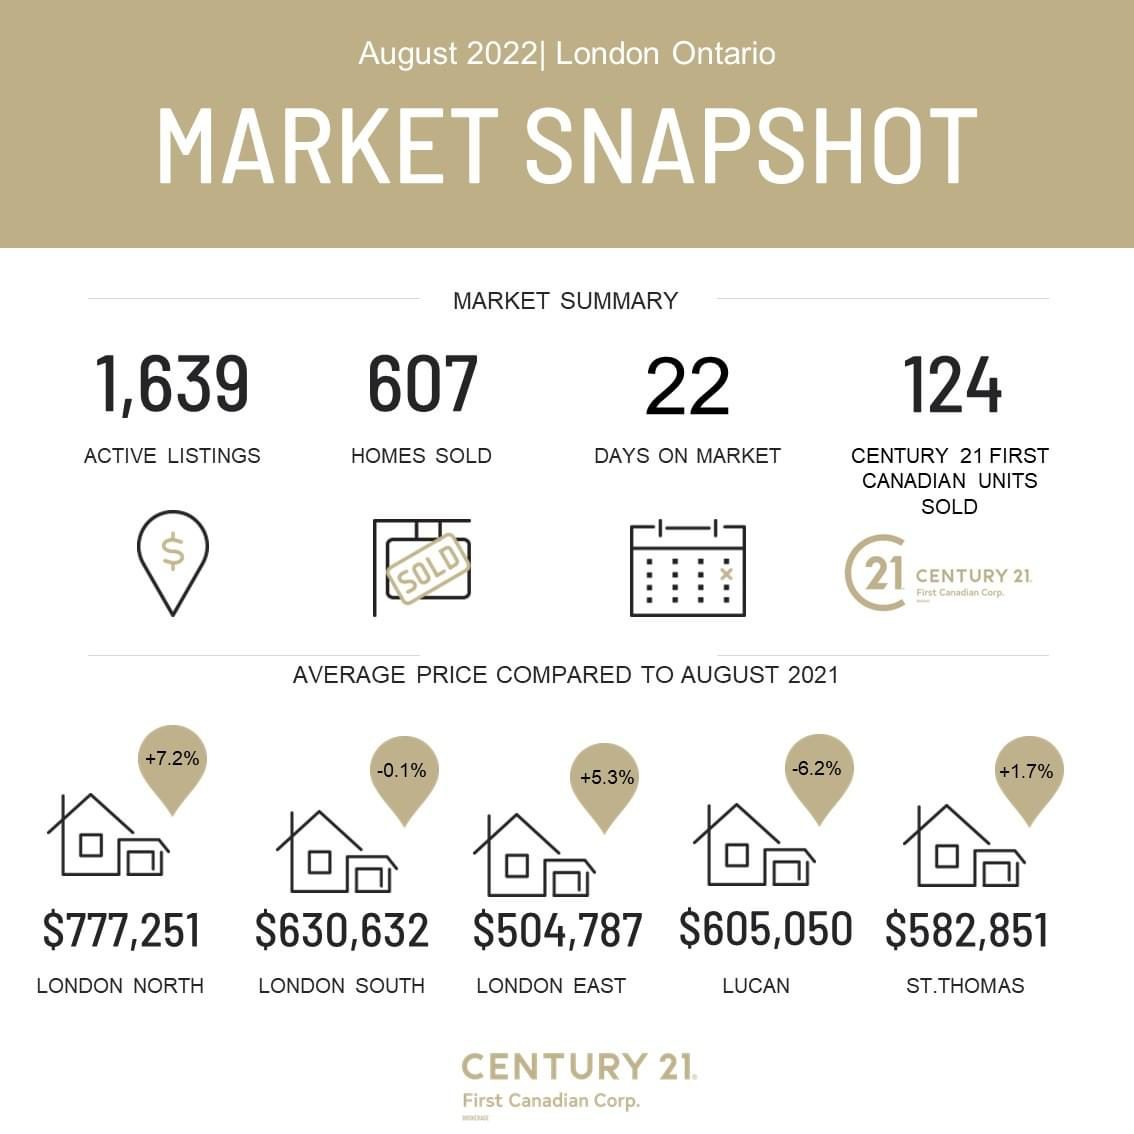
Area August 2022 MLS® HPI Benchmark Price August 2022 Average Price
Central Elgin $609,700 $731,641
London East $488,900 $504,787
London North $714,600 $777,251
London South $594,200 $630,632
Middlesex Centre $851,000 $1,335,846
St. Thomas $520,600 $582,851
Strathroy-Caradoc $719,800 $570,692
LSTAR $599,500 $648,036

“The single-family home remained on top of the local home buyers’ preferences – with 473 units sold – but apartments saw the largest gain in average price, increasing 5.4% over the same time a year ago,” Pawlowski said.

The following table shows the August benchmark prices for all housing types in LSTAR’s jurisdiction and how they stack up against the values from the previous year.

MLS® Home Price Index Benchmark Prices
Benchmark Type August 2022 Change over August 2021
LSTAR Composite $599,500 ↑ 0.5%
LSTAR Single-Family $637,600 ↑ 0.0%
LSTAR One Storey $576,100 ↑ 1.9%
LSTAR Two Storey $679,600 ↓ 0.9%
LSTAR Townhouse $511,700 ↑ 1.4%
LSTAR Apartment $421,600 ↑ 5.4%

“When compared to other values recorded provincially and nationally, homes in our area continue to remain relatively affordable,” Pawlowski said. The following chart shows HPI benchmark prices for August, courtesy of the Canadian Real Estate Association (CREA).

Read more

July 7, 2022

LSTAR’s News Release for June 2022

LSTAR’s News Release for June 2022

Market Cools off in June

1,727 new residential listings and 663 home sales were recorded in June 2022 in the London-St. Thomas area via the MLS® System of the London and St. Thomas Association of REALTORS® (LSTAR).  The local housing supply increased from only 1.7 months of inventory in May to 2.8 months of inventory in June.

“While the number of new listings is the highest ever recorded by LSTAR in the month of June, the number of June home sales is at its lowest point in the last ten years,” said Randy Pawlowski, 2022 LSTAR President. “Our local market is cooling off rapidly, but home prices don’t follow suit as fast,” he added.

LSTAR’s composite MLS® Home Price Index Benchmark Price was down 7.8% from May, decreasing from $703,300 in May to $648,500 last month. However, this value is still 10.1% greater than the figure recorded in June 2021. Similarly, LSTAR’s overall average home price fell from $762,397 in May to $686,287 in June. Compared to the same period last year, this figure is still 8.9% higher.

“While the three consecutive interest rate hikes by the Bank of Canada succeeded to put some downward pressure on the home prices, the low housing supply is what keeps them relatively elevated. Even if the number of months of inventory increased to almost three, this value is still lower than normal. In a balanced market, the inventory should sit at 3.5 or 4 months,” Pawlowski said.

The following table shows how June’s average home sales prices in LSTAR’s main regions compare to the benchmark prices for the same areas.

Area June 2022 MLS® HPI Benchmark Price June 2022 Average Price
Central Elgin $637,700 $616,591
London East $524,900 $547,492
London North $781,700 $807,984
London South $644,100 $696,067
Middlesex Centre $925,400 $1,007,905
St. Thomas $537,300 $576,680
Strathroy-Caradoc $794,000 $657,051
LSTAR $648,500 $686,287

“The favourite dwelling type of the local home buyers remains the single-family home: out of the 663 units sold last month, 493 were single-family homes,” Pawlowski explained. “The rest of the June transactions were comprised of 82 condo sales and 58 apartment sales,” he added.

In June, the average price for a single-family home in LSTAR’s jurisdiction stood at $736,158, that of a condo – at $583,321, and the overall average price for an apartment – at $413,576.

The following table shows the June benchmark prices for all housing types in LSTAR’s jurisdiction and how they stack up against the values from a year ago.

MLS® Home Price Index Benchmark Prices
Benchmark Type June 2022 Change over June 2021
LSTAR Composite $648,500 ↑ 10.1%
LSTAR Single-Family $689,000 ↑ 9.1%
LSTAR One Storey $626,900 ↑ 9.7%
LSTAR Two Storey $731,500 ↑ 8.9%
LSTAR Townhouse $575,800 ↑ 16.4%
LSTAR Apartment $425,900 ↑ 10.6%

“Even if it’s higher than in many cities from other Canadian provinces, LSTAR’s composite HPI benchmark price places our area among the most affordable in Ontario,” Pawlowski observed. The following chart is based on data provided by the Canadian Real Estate Association (CREA) for June 1st, 2022.

MLS® Home Price Index Benchmark Prices in Canada - June 1, 2022

Read more


LSTAR’s Statistical Package for June 2022

The June 2022 Statistical Package of LSTAR has 751 pages. Because it is a large file, it might take a longer time to load on your screen.

The Stats Package includes the MLS® HPI benchmark prices for all neighbourhoods and subdivisions that fall under the jurisdiction of LSTAR, as well as descriptions of benchmark homes for each of these.

To navigate the Stats Pack PDF file, click on the hamburger symbol  displayed in the left upper corner of your screen to reveal all the bookmarks of the document.
To find information about London East, please go to “East Residential”. The information about London North can be found under “North Residential” and the London South data – under “South Residential”.

Click on the following link to see the complete Statistical Package of LSTAR for June 2022:

June 7, 2022

Market Snapshot for month of May 2022

June 3, 2022

May Market Updates

LSTAR’s News Release for May 2022

Inventory Levels Rise, but Prices Remain Elevated

In May 2022, 1,835 new residential listings were posted on the MLS® System of the London and St Thomas Association of REALTORS® (LSTAR), more than in any previous May in the Association’s history. The local housing supply increased from only 1.2 months of inventory in April to 1.7 months of inventory in May.

Sales, on the other hand, were more on par with those from the former decade, with only 844 homes exchanging hands last month in LSTAR’s jurisdiction.

“Even if in May the sales-to-new listings ratio dropped to 46%, a figure that, typically, indicates a market that tends to favour home buyers, benchmark and average prices saw only modest month-over-month declines,” said Randy Pawlowski, 2022 LSTAR President. “Compared to last year’s figures, both of these values are substantially higher,” he added.

LSTAR’s composite MLS® Home Price Index Benchmark Price was down 4% over April, falling from $739,700 in April to $703,300 last month. However, this value is still 17.6% greater than the figure recorded in May 2021. Similarly, LSTAR’s overall average home price decreased from $771,682 in April to $762,397 in May. Compared to the same period last year, this figure is 19.5% higher.

“One of the reasons why we are witnessing this level of stability is the change in population from migration and immigration. Only in the fourth quarter of 2021, Ontario’s population saw a net increase of 34,074 people. Many of these new Ontarians are now looking to buy homes they can afford in regions with good schools and hospitals. And, as it happens, our area checks all these boxes.” Pawlowski explained.

“Aside from the growing population, the existing housing supply is another factor that puts upward pressure on the local home prices. While the months of inventory saw slight increases, they are still at lower-than-usual levels. Normally, a healthy inventory should sit at around 3.5 or 4 months,” Pawlowski said.

The following table shows how May’s average home sales prices in LSTAR’s main regions compare to the benchmark prices for the same areas.

Area May 2022 MLS® HPI Benchmark Price May 2022 Average Price
Central Elgin $718,000 $825,705
London East $570,800 $575,867
London North $840,800 $890,455
London South $699,500 $750,388
Middlesex Centre $990,300 $1,270,684
St. Thomas $597,800 $645,711
Strathroy-Caradoc $875,200 $779,431
LSTAR $703,300 $762,397

Out of the 844 units sold last month, 635 were single-family homes, 105 – condo townhouses, and 65 – apartments.

In May, the average price for a single-family home in LSTAR’s jurisdiction stood at $818,977, that of a condo – at $605,333, and the overall average price for an apartment – at $465,364.

The following table shows the May benchmark prices for all housing types in LSTAR’s jurisdiction and how they stack up against the values from a year ago.

MLS® Home Price Index Benchmark Prices
Benchmark Type May 2022 Change over May 2021
LSTAR Composite $703,300 ↑ 17.6%
LSTAR Single-Family $749,100 ↑ 17%
LSTAR One Storey $681,800 ↑ 17.6%
LSTAR Two Storey $795,300 ↑ 16.8%
LSTAR Townhouse $609,700 ↑ 22.5%
LSTAR Apartment $473,400 ↑ 19.4%

“Even if it’s higher than in many cities from other Canadian provinces, LSTAR’s composite HPI benchmark price places our area among the most affordable in Ontario,” Pawlowski observed. The following chart is based on data provided by the Canadian Real Estate Association (CREA) for May 1st, 2022.

MLS® Home Price Index Benchmark Prices in Canada - May 1, 2022

Read more

June 1, 2022

Bank of Canada Hikes Interest Rates

CANADA

Bank of Canada Hikes Interest Rates And Its Inflation Forecast

Canada’s central bank reiterated its commitment to lower elevated inflation. The Bank of Canada (BoC) hiked the overnight rate and is going ahead with quantitative tightening (QT). It wasn’t much of a surprise, as it was widely expected by the market. What is surprising is the BoC raised its inflation forecast once again. This may indicate they’re even further behind on rate hikes than previously believed.

Bank of Canada Raises Interest Rates By 50 Basis Points (BPS)

The BoC delivered its widely-expected “super” hike today — slang for a 0.5 point hike, double the usual pace. The overnight rate is now at 1.5 points, about 6x the historic low reached as recently as the start of this year. Despite all of the complaints, Canada’s interest rates are still below the 1.75% it started this decade with.

Elevated inflation is driving the need for higher rates, repeated by the central bank. They warned despite rates rising aggressively, it’ll take time to cool inflation. In the meantime, inflation momentum is expected to continue, rising even higher.

“[Consumer Price Index] CPI inflation reached 6.8% for the month of April – well above the Bank’s forecast – and will likely move even higher in the near term before beginning to ease,” said BoC Governor Macklem in a prepared speech.

Much higher rates might be in the cards, with a rising neutral policy rate needed. “The risk of elevated inflation becoming entrenched has risen. The Bank will use its monetary policy tools to return inflation to target and keep inflation expectations well anchored,” said the Governor.

Bank of Canada Raises Its Inflation Forecast

Higher inflation isn’t just a near-term issue but forecasts are climbing too. CPI is forecast to show annual growth of 5.3% in 2022, up from 4.2% in the previous forecast. Next year they anticipate 2.8% growth, up 0.5 points from the previous forecast. That’s within the range of tolerable inflation, but the 3.0% upper bound is less than one revision away.

“With the economy in excess demand, and inflation persisting well above target and expected to move higher in the near term, the Governing Council continues to judge that interest rates will need to rise further,” explains the central bank in the Monetary Policy Report (MPR) that accompanies today’s announcement.

“The pace of further increases in the policy rate will be guided by the Bank’s ongoing assessment of the economy and inflation, and the Governing Council is prepared to act more forcefully if needed to meet its commitment to achieve the 2% inflation target,” reads the BoC report.

Rising rates are expected to dampen what the BoC called “excess demand,” but it might take a while. At the same time, downward revisions are just as likely as upward ones have been, if inflation cools.

Uncategorized May 4, 2022

April 2022 Market Updates

LSTAR’s News Release for April 2022

April Figures Suggest a Soft Landing of the Local Real Estate Market

In April 2022, 877 homes traded hands in the London-St. Thomas area and 1,069 new property listings were posted on the MLS® System of the London and St. Thomas Association of REALTORS® (LSTAR). The local housing supply bounced up to 1.2 months of inventory in April from only 0.6 months in March.

“These figures suggest a soft landing of the local real estate market: the April home sales are on par with the ten-year average and last month’s sales-to-new listings ratio of 54.5% signals that we’re trending towards a more balanced market,” said Randy Pawlowski, 2022 LSTAR President.

Within the same time frame, LSTAR’s composite Home Price Index Benchmark Price saw a 4.5% month-over-month decline – from $774,200 in March to $739,700 in April. A similar difference was also seen in LSTAR’s overall average home price, which decreased from $823,954 in March to $771,682 in April.

“There is nothing dramatic about the decline in home prices. These single-digit decreases were actually expected after two consecutive interest rate hikes by the Bank of Canada and the Ontario Government’s decision to expand and increase the non-resident speculation tax,” Pawlowski explained.

The following table shows how April’s average home sales prices in LSTAR’s five main regions compare to the benchmark prices for the same areas.

Area April 2022 MLS® HPI Benchmark Price April 2022 Average Price
Central Elgin $773,000 $900,732
London East $647,600 $597,652
London North $863,900 $874,712
London South $731,900 $772,829
Middlesex Centre $1,076,700 $1,192,683
St. Thomas $628,100 $688,116
Strathroy-Caradoc $825,500 $823,380
LSTAR $739,700 $771,682

Out of the 877 units sold last month, 648 were single-family homes, 121 – condo townhouses, and 74 – apartments.

“In April, the average price for a single-family home in LSTAR’s jurisdiction sat at $840,415, that of a condo – at $618,049, and the overall average price for an apartment – at $476,283,” Pawlowski said. “Speaking of apartments, it’s interesting to see that their HPI benchmark price increased in April by 3.7% over the previous month, while the benchmark prices for all the other home types saw month-over-month single-digit reductions,” he noted.

The following table shows the April benchmark prices for all housing types in LSTAR’s jurisdiction and how they measure up to the values from a year ago.

MLS® Home Price Index Benchmark Prices
Benchmark Type April 2022 Change over April 2021
LSTAR Composite $739,700 ↑ 25.1%
LSTAR Single-Family $789,700 ↑ 23.7%
LSTAR One Storey $742,500 ↑ 26.6%
LSTAR Two Storey $838,300 ↑ 21.8%
LSTAR Townhouse $599,900 ↑ 26.1%
LSTAR Apartment $461,400 ↑ 37.0%

“Even if it’s much higher than in many cities from Alberta and Saskatchewan, LSTAR’s aggregate HPI benchmark price places our area among the most affordable in Ontario,” Pawlowski observed. The following chart is based on data provided by the Canadian Real Estate Association (CREA) for April 1st, 2022.

HPI Benchmark Home Prices Across Canada - April 2022
Read more

April 4, 2022

March Updates

LSTAR‘s News Release for March 2022

March Sees Record Number of Listings, but Inventory Remains Low

1,049 homes were sold in March 2022 in the London-St. Thomas area via LSTAR‘s MLS® System. During the same time frame, 1,544 listings came on the local market, which makes last month the March with the highest number of listings in the history of the London and St. Thomas Association of REALTORS®.

“Despite the record number of listings, our inventory – the number of active listings at month end – saw just a slight increase from last month, creeping up from 0.5 months to only 0.6,” said Randy Pawlowski, 2022 LSTAR President. “The sales-to-new-listings ratio for the entire jurisdiction of LSTAR was 67.9%, much lower than a year ago, but still indicating a Sellers’ market,” he continued. “The latest interest rate hike by the Bank of Canada may have put a damper on what has been so far a truly fierce competition among local home buyers,” he explained.

In March, the overall average price for all home types in our area was $823,954, whereas LSTAR‘s composite MLS® Home Price Index Benchmark Price sat at $774,200. “These figures suggest that the pace of home price gains might have started to slow down in our area,” Pawlowski said. “It’s way too early to predict the impact of this new measure, but Ontario Government’s recent decision to increase the non-resident speculation tax to 20% and expand it throughout the whole province might also help tame home prices,” he added.

The following table shows how March’s average home sales prices in LSTAR‘s five main regions compare to the benchmark prices for the same areas.

Area March 2022 MLS® HPI Benchmark Price March 2022 Average Price
Central Elgin $826,600 $927,880
London East $685,600 $669,005
London North $894,800 $947,700
London South $770,100 $823,904
Middlesex Centre $1,085,800 $1,228,124
St. Thomas $665,200 $728,860
Strathroy-Caradoc $869,200 $860,138
LSTAR $774,200 $823,954

Out of the 1,049 units sold last month, 756 were single-family homes, 140 – condo townhouses, and 107 – apartments.

“In March, the average price for a single-family home in LSTAR‘s jurisdiction sat at $894,306, that of a condo – at $692,187 and the overall average price for an apartment – at $501,961,” Pawlowski said. “Regarding condo townhouses, it’s interesting to see how well they are selling and how much their benchmark price has appreciated in the last year: last month was LSTAR‘s second-best March for condominium sales and the MLS® HPI benchmark price for a local apartment has grown by 49.7% over a year ago,” he noted.

The following table shows the March benchmark prices for all housing types in LSTAR‘s jurisdiction and how they compare with the values from a year ago.

MLS® Home Price Index Benchmark Prices
Benchmark Type March 2022 Change over March 2021
LSTAR Composite $774,200 ↑ 35.9%
LSTAR Single-Family $831,100 ↑ 33.4%
LSTAR One Storey $777,900 ↑ 40.1%
LSTAR Two Storey $884,700 ↑ 29.3%
LSTAR Townhouse $638,700 ↑ 49.7%
LSTAR Apartment $445,100 ↑ 36.5%

“The latest figures achieved by LSTAR‘s HPI benchmark prices and average sale prices place our area somewhere in the middle of the Canadian home affordability scale,” Pawlowski observed. The following table is based on data provided by the Canadian Real Estate Association (CREA) for March 1st, 2022.

Read more